Demographics
Gender Data 2023

| Faculty Gender 2023 | Percentage |
| Male | 60.30% |
| Female | 39.70% |

| Staff Gender 2023 | Percentage |
| Male | 34.30% |
| Female | 65.70% |

| UG Gender, 2023 | Percentage |
| Male | 52.00% |
| Female | 47.90% |

| Graduate Students Gender, 2023 | Percentage |
| Male | 44% |
| Female | 56% |
Ethnicities Data 2023
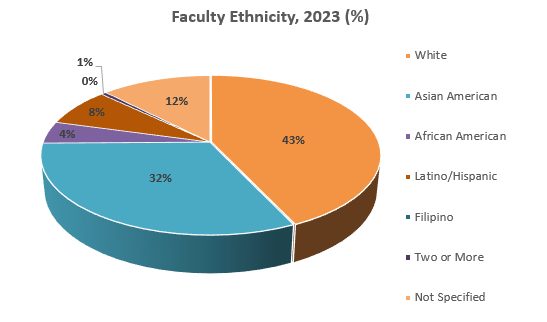
| Faculty Ethnicities 2023 | Percentage |
| White | 43.00% |
| Asian American | 31.80% |
| African American | 4.50% |
| Latino/Hispanic | 7.80% |
| Filipino | 0% |
| Two or More | 0.60% |
| Not Specified | 12.30% |

| Staff Ethnicities 2023 | Percentage |
| White | 25.70% |
| Asian American | 25.70% |
| African American | 2.90% |
| Latino/Hispanic | 34.30% |
| Filipino | 2.90% |
| Two or More | 8.60% |

| Undergrad Ethnicities, 2023 | Percentage |
| White | 13.10% |
| Asian American | 21.50% |
| African American | 3.30% |
| Latino/Hispanic | 49.60% |
| American Indian or Alaska Native | 0.10% |
| Native Hawaiian or Pacific Islander | 0.30% |
| Two or More | 4.30% |
| Not Specified | 1.80% |
| Visa Non-U.S. | 6.10% |

| Graduate Students Ethnicity, 2023 % | Percentage |
| White | 15.40% |
| Asian American | 19.20% |
| African American | 5.80% |
| Latino/Hispanic | 41.90% |
| American Indian or Alaska Native | 0.50% |
| Native Hawaiian or Pacific Islander | 0.30% |
| Two or More | 3.90% |
| Not Specified | 3.90% |
| Visa Non-U.S. | 9.10% |